EURUSD, USDJPY, GBPUSD, AUDUSD, USDCAD, XAUUSD, and Brent technical analysis and forecast for 14 April 2025
Here is a detailed daily technical analysis and forecast for EURUSD, USDJPY, GBPUSD, AUDUSD, USDCAD, XAUUSD, and Brent for 14 April 2025.
EURUSD forecast
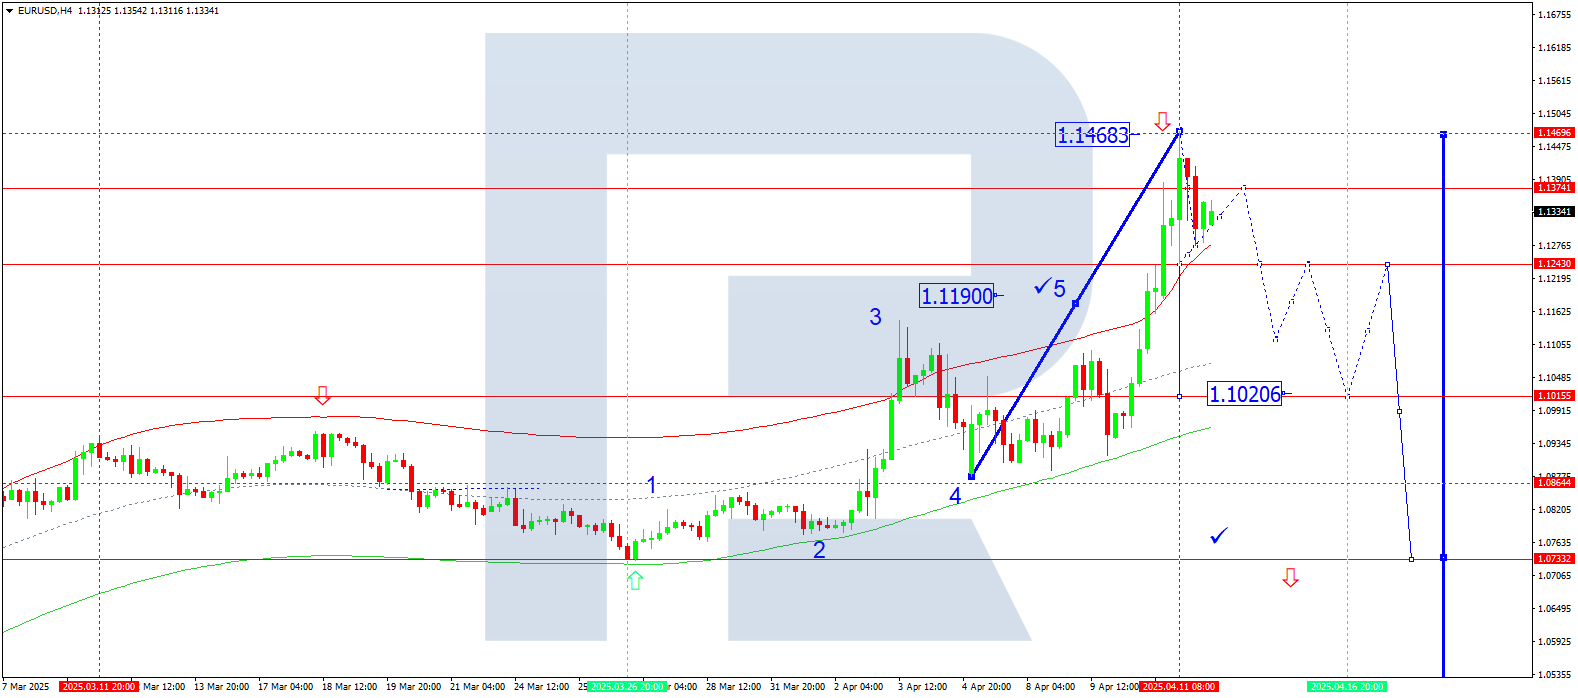
On the H4 chart of EURUSD, the market completed a downward wave to 1.1276. A growth leg is forming towards 1.1400. Today, 14 April 2025, the price may consolidate within this range. If the market breaks upwards, growth to 1.1470 is possible. A downward breakout could lead to a decline towards 1.1111 and 1.1020.
Technically, the Elliott wave structure and the growth wave matrix with a pivot at 1.1190 confirm this scenario. This level serves as the key within this wave structure for EURUSD. At the moment, the wave has reached the upper boundary of the price Envelope at 1.1468. A move towards the lower boundary at 1.1020 may follow.
Technical indicators for today's EURUSD forecast suggest a potential start of a downward wave to 1.1111 and 1.1020.
USDJPY forecast
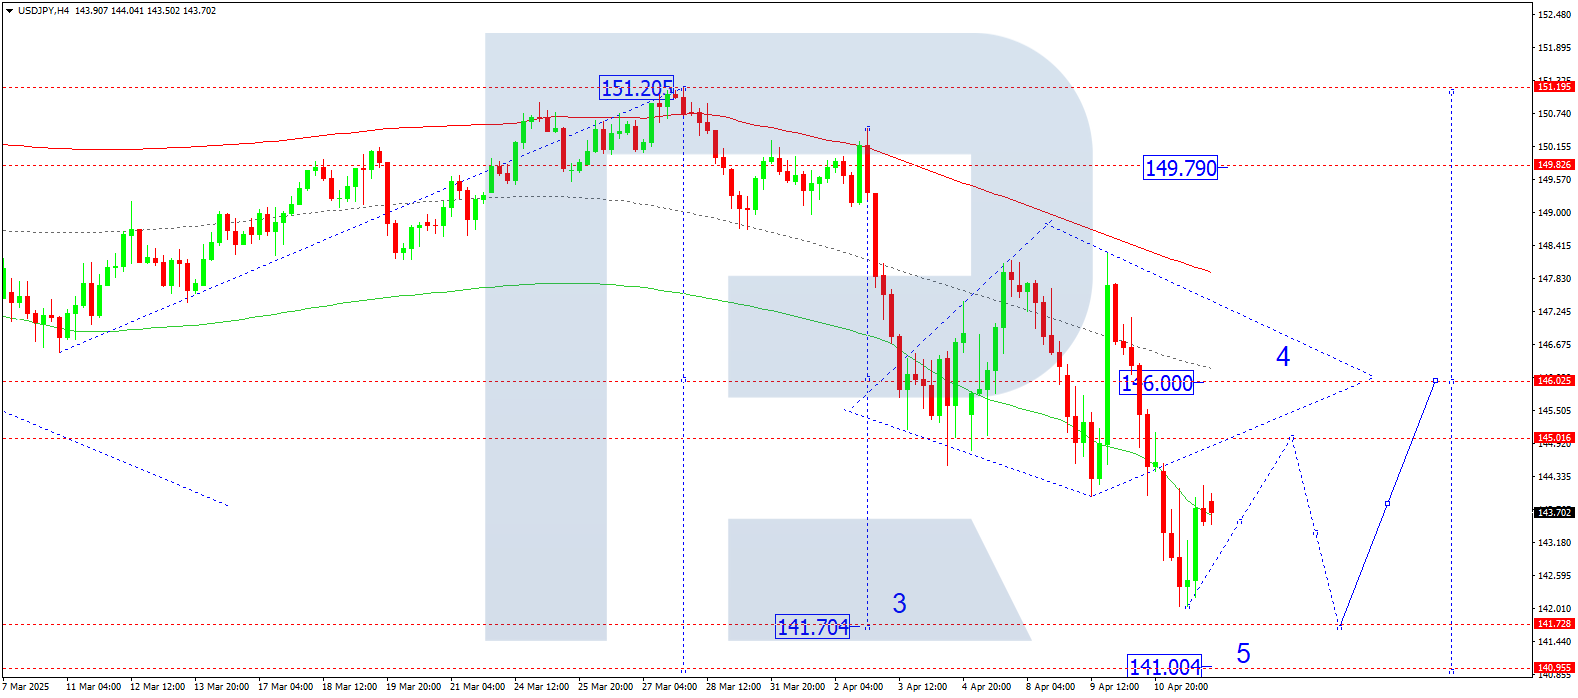
On the H4 chart of USDJPY, the market completed a downward wave to 142.06. Today, 14 April 2025, a rise to 145.00 (testing from below) is possible. Afterwards, the downward trend may continue towards 141.73 as a local target. After reaching it, a corrective leg to 145.00 is possible, followed by another decline towards 141.00.
Technically, the Elliott wave structure and the downward wave matrix with a pivot at 146.00 support this scenario. This level is key in the current wave structure. The market is forming the third wave of decline towards the lower boundary of the price Envelope at 141.73. A potential rebound towards the central line at 145.00 may follow.
Technical indicators for today's USDJPY forecast suggest a downward wave to 141.73.
GBPUSD forecast
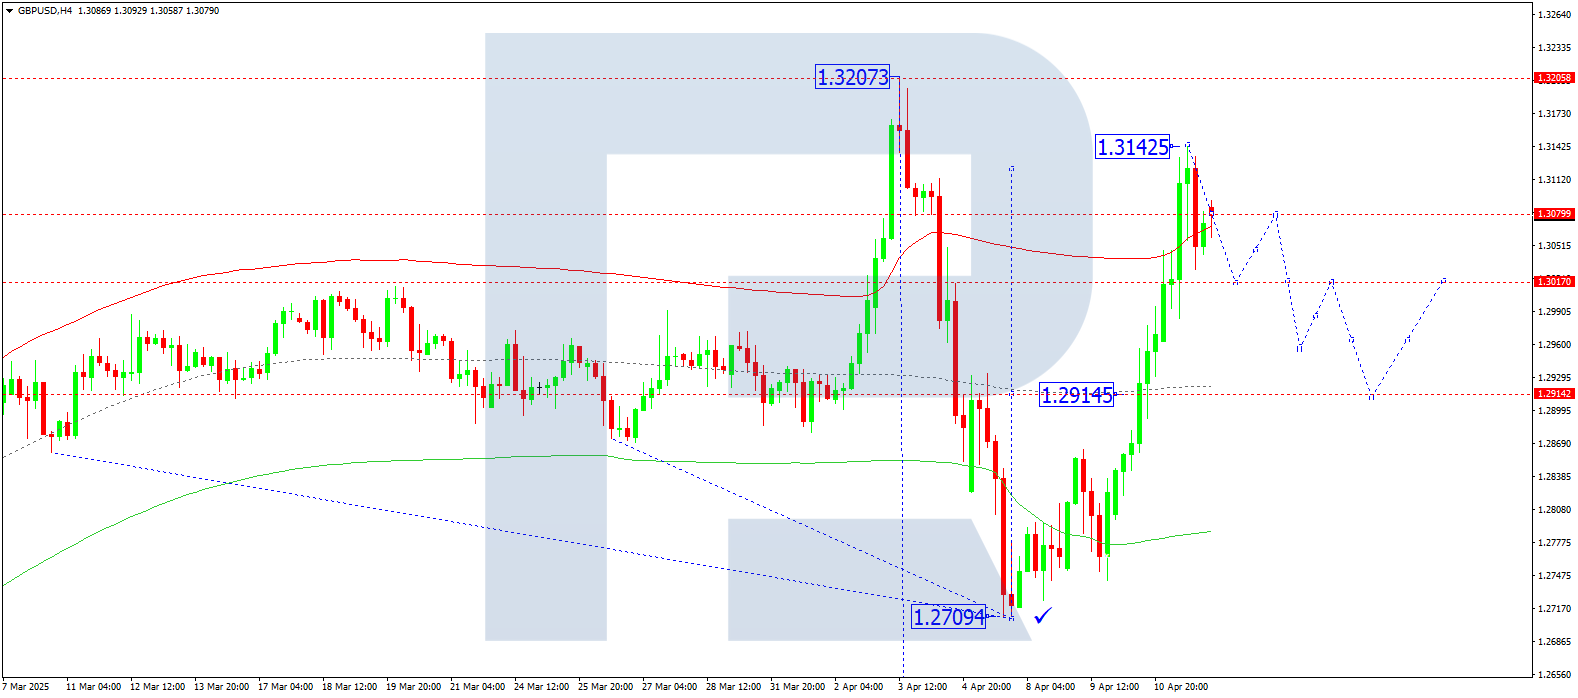
On the H4 chart of GBPUSD, the market completed a growth wave to 1.3142. Today, 14 April 2025, a pullback to 1.3017 is possible, followed by growth to 1.3080. Effectively, a consolidation range may form around 1.3080. An upward breakout could lead to a rise to 1.3150. If the price breaks downward, a decline towards 1.2960 and 1.2915 may develop.
Technically, this scenario is supported by the Elliott wave structure and the growth wave matrix with a pivot at 1.2915. This level is key in the current wave. The market reached the upper boundary of the price Envelope at 1.3142. A likely decline to the lower boundary at 1.2915 may follow.
Technical indicators for today's GBPUSD forecast suggest a downward wave to 1.2960 and 1.2915.
AUDUSD forecast
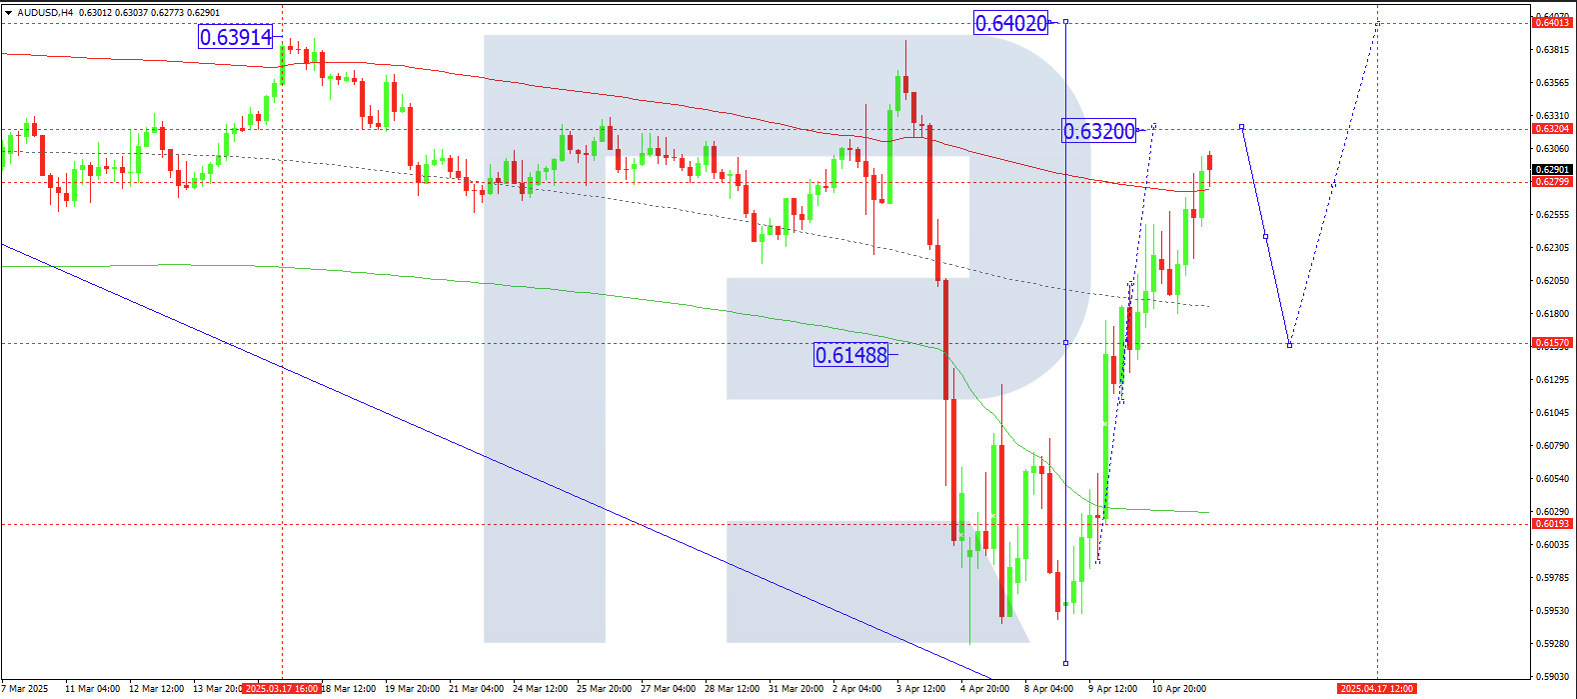
On the H4 chart of AUDUSD, the market formed a consolidation range around 0.6155 and broke upwards, continuing the growth wave to 0.6320. Today, 14 April 2025, the target level is expected to be reached. Afterwards, a downward wave towards 0.6155 may begin.
Technically, the Elliott wave structure and the growth wave matrix with a pivot at 0.6155 confirm this scenario. This level is key in the current wave structure. The price is currently moving towards the upper boundary of the price Envelope at 0.6320. Later, a decline towards the central line at 0.6155 may follow.
Technical indicators for today's AUDUSD forecast suggest a likely start of a downward wave to 0.6155.
USDCAD forecast
On the H4 chart of USDCAD, the market reached the local target of the downward wave at 1.3838. Today, 14 April 2025, a new upward wave towards 1.4088 may begin. After reaching this level, a decline to 1.3770 is possible.
Technically, the Elliott wave structure and the downward wave matrix with a pivot at 1.4088 confirm this scenario. This level acts as a key point in the current wave structure for USDCAD. The market has moved to the lower boundary of the price Envelope at 1.3838. A rebound towards the central line at 1.4088 is expected.
Technical indicators for today's USDCAD forecast suggest an upward wave to 1.4055.

XAUUSD forecast
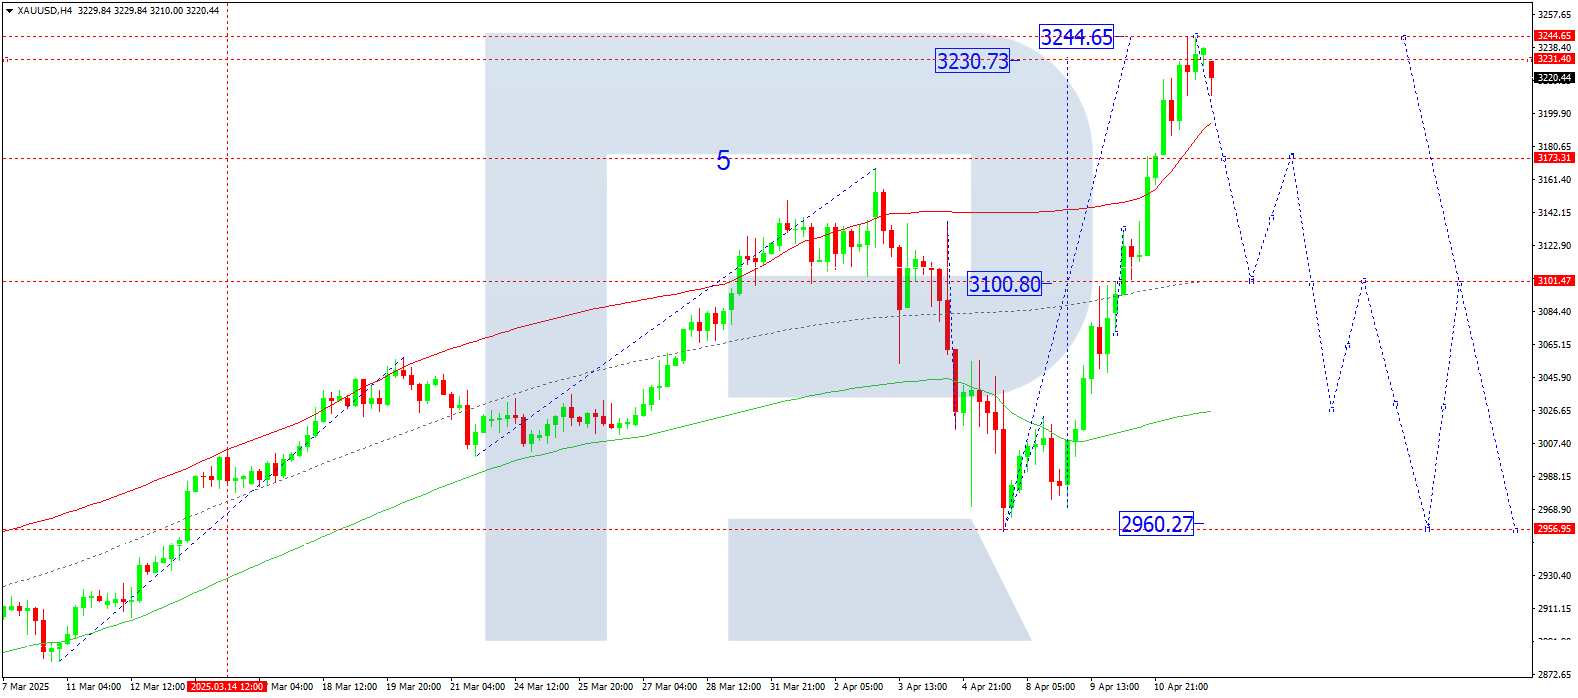
On the H4 chart of XAUUSD, the market completed a growth wave to 3,245. Today, 14 April 2025, a decline to 3,100 is expected as the first target.
Technically, this scenario is supported by the Elliott wave structure and the growth wave matrix with a pivot at 3,100. This level is considered key within the current wave structure for XAUUSD. The price has reached the upper boundary of the price Envelope at 3,245. A likely move towards the central line at 3,100 may follow.
Technical indicators for today's XAUUSD forecast indicate a potential start of a downward wave to 3,100.
Brent forecast
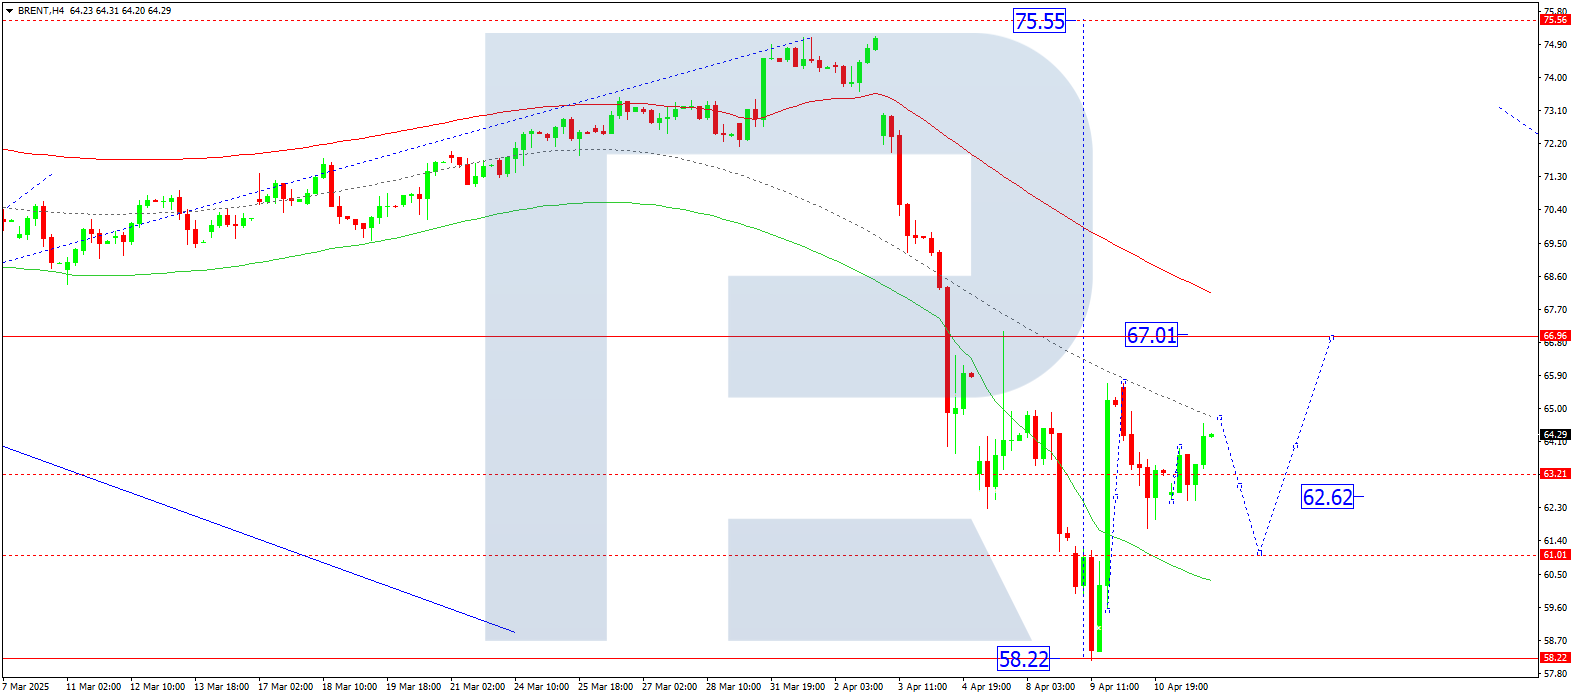
On the H4 chart of Brent crude, the market is forming a consolidation range around 63.22. Today, 14 April 2025, a rise towards 63.74 is expected, followed by a possible correction to 61.00. After completing this correction, the market may start a new upward wave to 67.00, the first target.
Technically, the Elliott wave structure and the downward wave matrix with a pivot at 63.36 confirm this scenario. This level is key within Brent's current correction. Today, the market is likely to complete the correction at the lower boundary of the price Envelope at 61.00, followed by a rise to the upper boundary at 67.00.
Technical indicators in today’s Brent forecast suggest the correction will end at 61.00 and a rise to 67.00 will follow.
Forecasts presented in this section only reflect the author’s private opinion and should not be considered as guidance for trading. RoboForex bears no responsibility for trading results based on trading recommendations described in these analytical reviews.