EURUSD, USDJPY, GBPUSD, AUDUSD, USDCAD, XAUUSD, and Brent technical analysis and forecast for 11 April 2025
Here is a detailed daily technical analysis and forecast for EURUSD, USDJPY, GBPUSD, AUDUSD, USDCAD, XAUUSD, and Brent for 11 April 2025.
EURUSD forecast
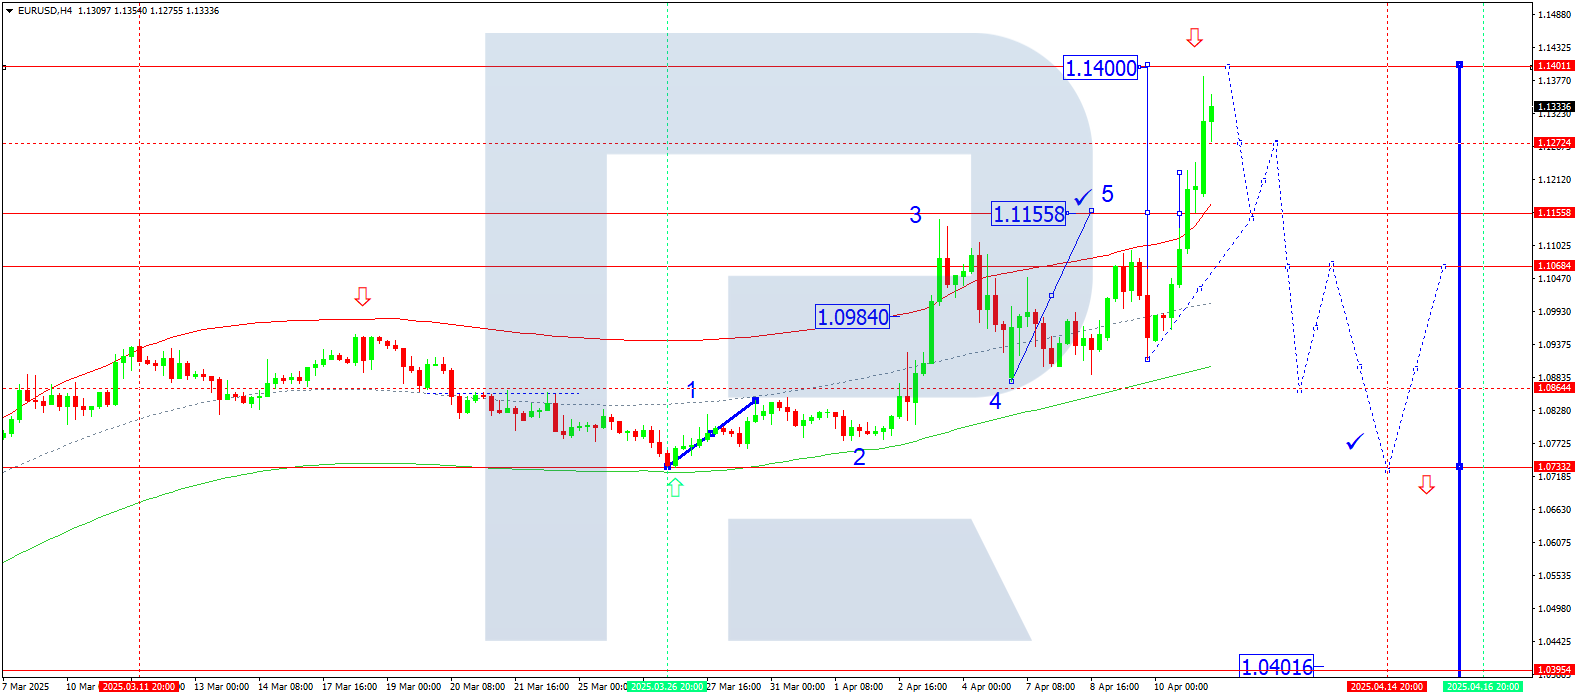
On the H4 chart of EURUSD, the market completed a growth wave to 1.1155 and formed a consolidation range around this level. Today, 11 April 2025, having gained support at this level, the market extended the upward movement to 1.1380. A pullback to 1.1155 (testing from above) may follow. Later, another upward wave towards 1.1400 is possible. This level would likely mark the end of this growth potential.
Technically, the Elliott wave structure and the growth wave matrix with a pivot point at 1.0980 confirm this scenario, identifying it as a key level in the current wave structure for EURUSD. At the moment, the wave is developing towards the upper boundary of the price Envelope at 1.1400. Afterwards, a possible decline to the central line at 1.1155 may follow.
Technical indicators for today's EURUSD forecast suggest a correction to 1.1155 and a further rise to 1.1400.
USDJPY forecast
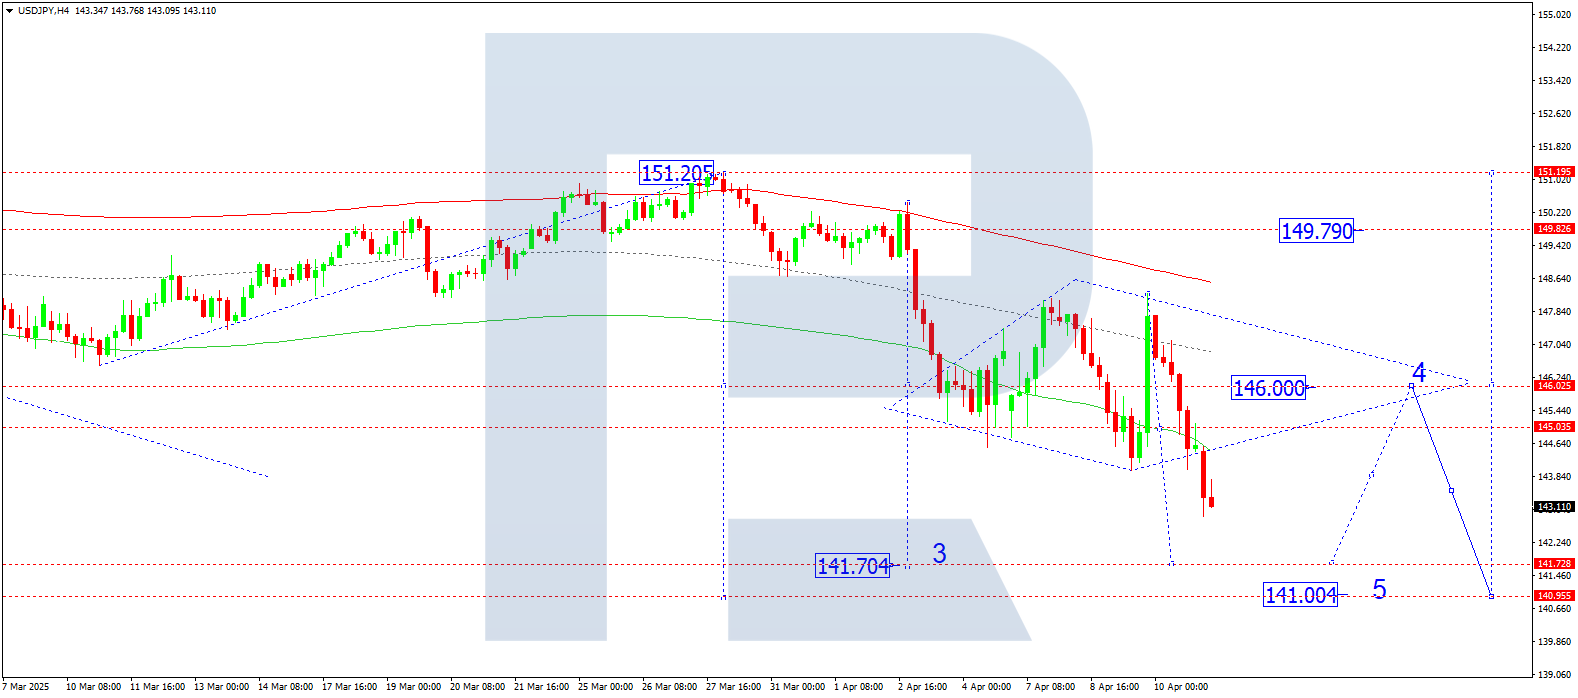
On the H4 chart of USDJPY, the market formed a wide consolidation range around 146.00. Today, 11 April 2025, the market broke out of the range downwards, opening the potential for a wave towards 141.72, the local target. After reaching this level, a correction to 145.00 (testing from below) may follow. Then, another downward wave towards 141.00 is possible.
Technically, the Elliott wave structure and the downward wave matrix with a pivot at 146.00 support this scenario. It acts as a key level in this wave structure. Currently, the market is shaping the third wave of decline towards the lower boundary of the price Envelope at 141.72. Later, a possible rise towards its central line at 145.00 may follow.
Technical indicators for today’s USDJPY forecast suggest a wave of decline to 141.72.
GBPUSD forecast
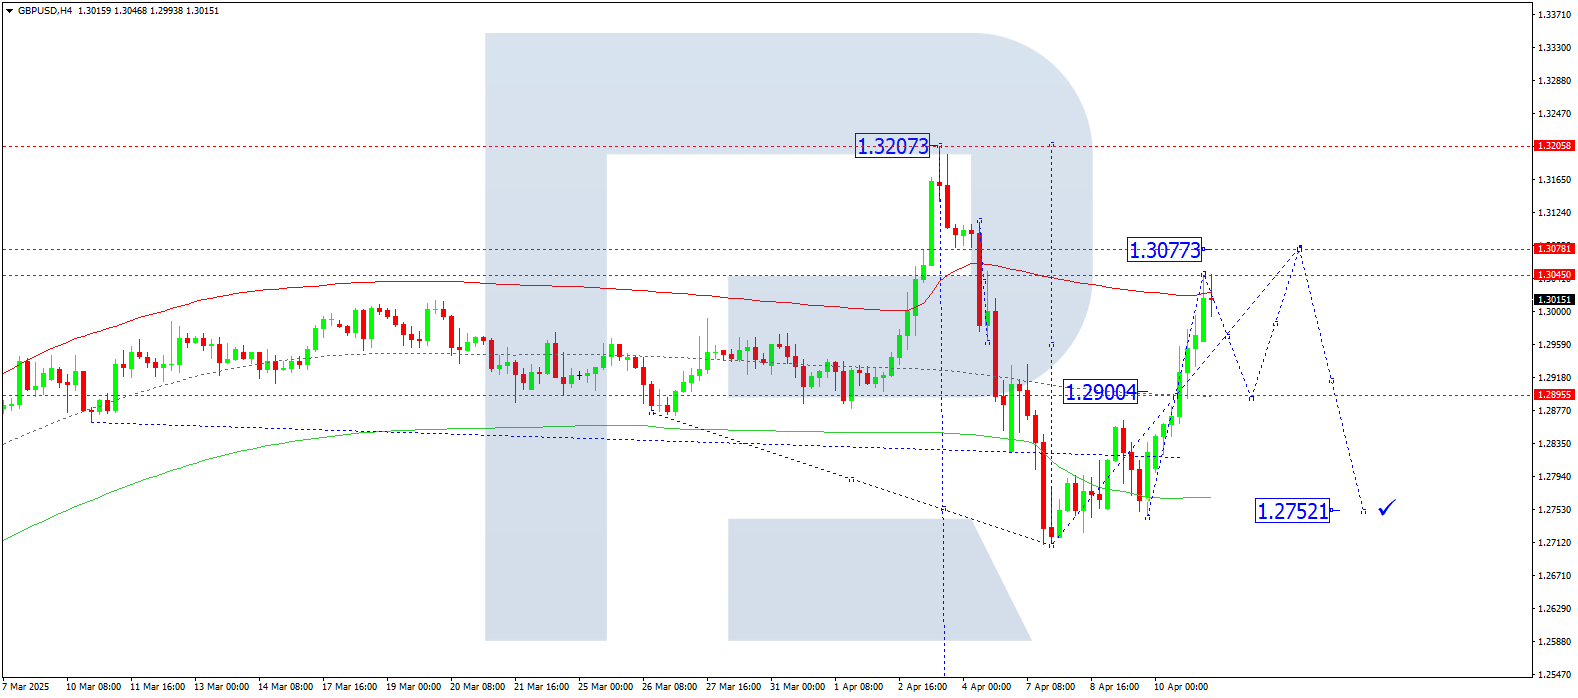
On the H4 chart of GBPUSD, the market gained support at 1.2900 and completed a growth wave to 1.3045. Today, 11 April 2025, a pullback to 1.2900 (testing from above) may occur. Afterwards, another upward wave to 1.3077 is possible.
Technically, the Elliott wave structure and the growth wave matrix with a pivot at 1.2900 confirm this scenario. This level is key in the current wave. The market reached the upper boundary of the price Envelope at 1.3045. A possible decline to the central line at 1.2900 may follow, before a potential continuation of growth towards the upper boundary at 1.3077.
Technical indicators for today’s GBPUSD forecast suggest a pullback to 1.2900.
AUDUSD forecast
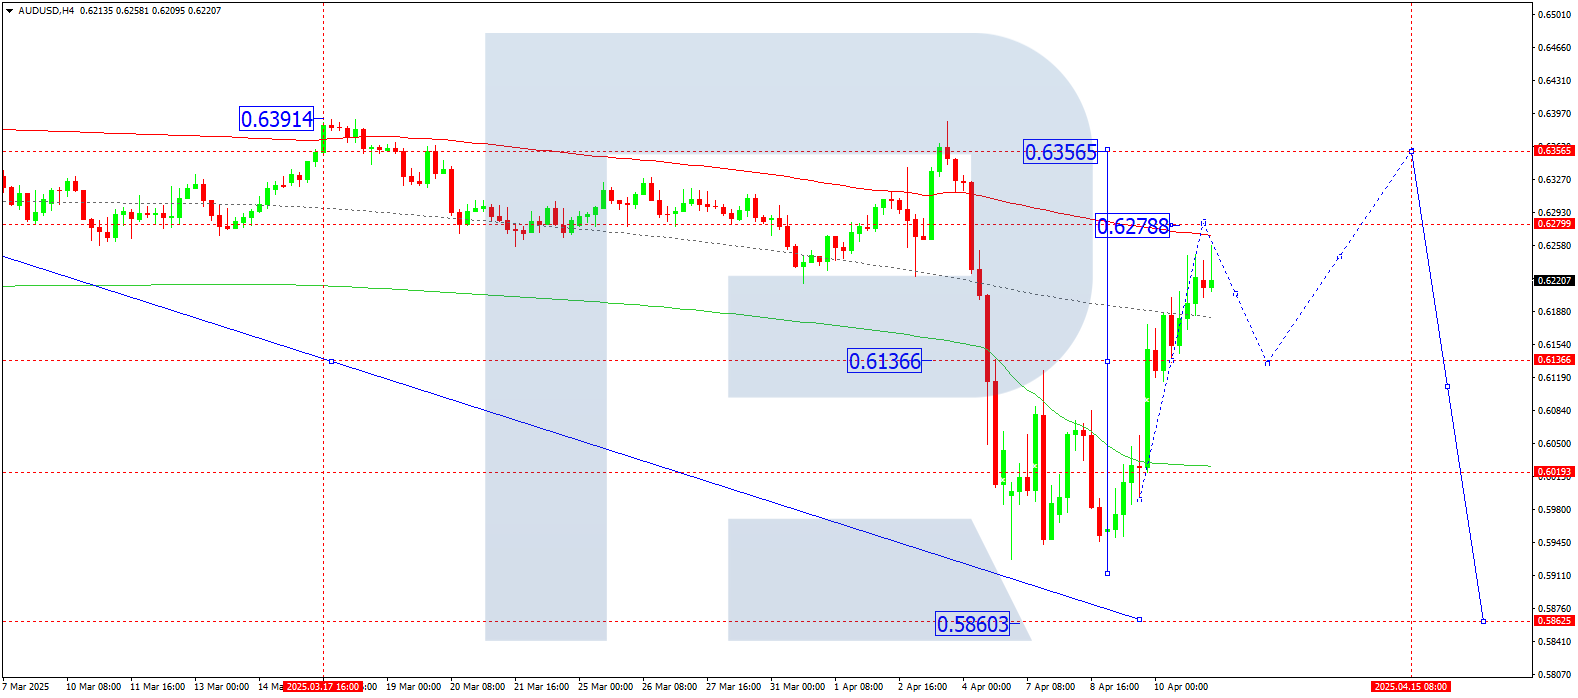
On the H4 chart of AUDUSD, the market formed a consolidation range around 0.6136. Today, 11 April 2025, after breaking upwards, the market completed a growth wave to 0.6193. A pullback to 0.6136 (testing from above) is possible. Then, a further rise to 0.6278 may follow, with a potential continuation of the trend to 0.6355.
Technically, the Elliott wave structure and the growth wave matrix with a pivot at 0.6136 confirm this scenario. This level is key in the current wave structure. The wave is developing towards the upper boundary of the price Envelope at 0.6278. Later, a pullback to the central line at 0.6136 may follow.
Technical indicators for today’s AUDUSD forecast suggest a continued rise to 0.6278.
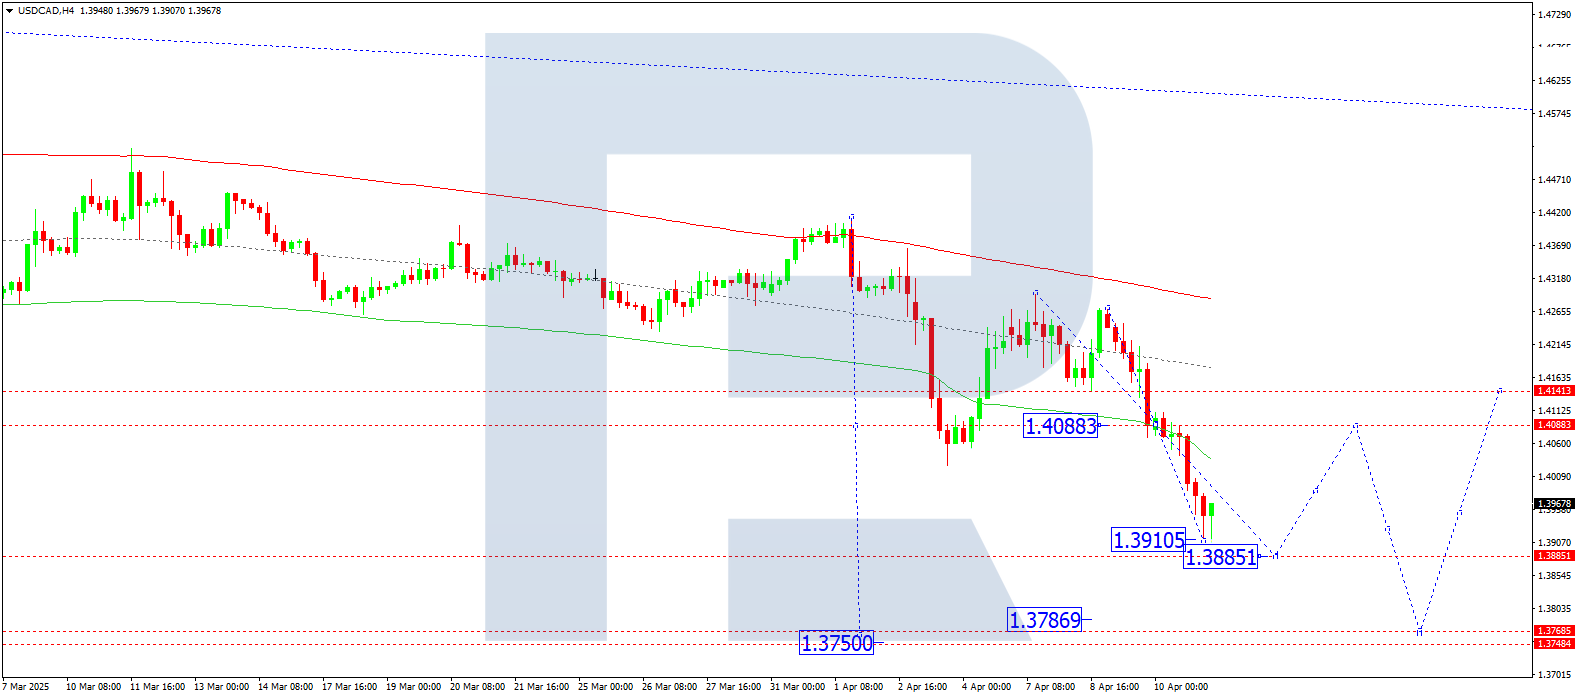
USDCAD forecast
On the H4 chart of USDCAD, the market broke through 1.4088 downwards and continues declining towards 1.3885. Today, 11 April 2025, this target may be reached. Afterwards, a correction to 1.4088 (testing from below) is possible, followed by another downward move to 1.3769.
Technically, the Elliott wave structure and the downward wave matrix with a pivot at 1.4088 confirm this scenario. This level acts as a key point for USDCAD in the current wave. The market is currently forming a wave towards the lower boundary of the price Envelope at 1.3885. After reaching this level, a rise to the central line at 1.4088 is possible.
Technical indicators for today’s USDCAD forecast suggest a downward move to 1.3885.
XAUUSD forecast
On the H4 chart of XAUUSD, the market gained support at 3,100 and continues rising towards 3,230. Today, 11 April 2025, this target may be reached. Afterwards, a correction to 3,100 is expected. Then, another upward wave towards 3,244 may follow.
Technically, the Elliott wave structure and the growth wave matrix with a pivot at 3,100 support this scenario. This level acts as a key one in this wave structure. Currently, the market is forming a wave towards the upper boundary of the price Envelope at 3,230. After reaching this target, a move back to the central line at 3,100 may follow.
Technical indicators for today’s XAUUSD forecast indicate the likelihood of growth to 3,230.

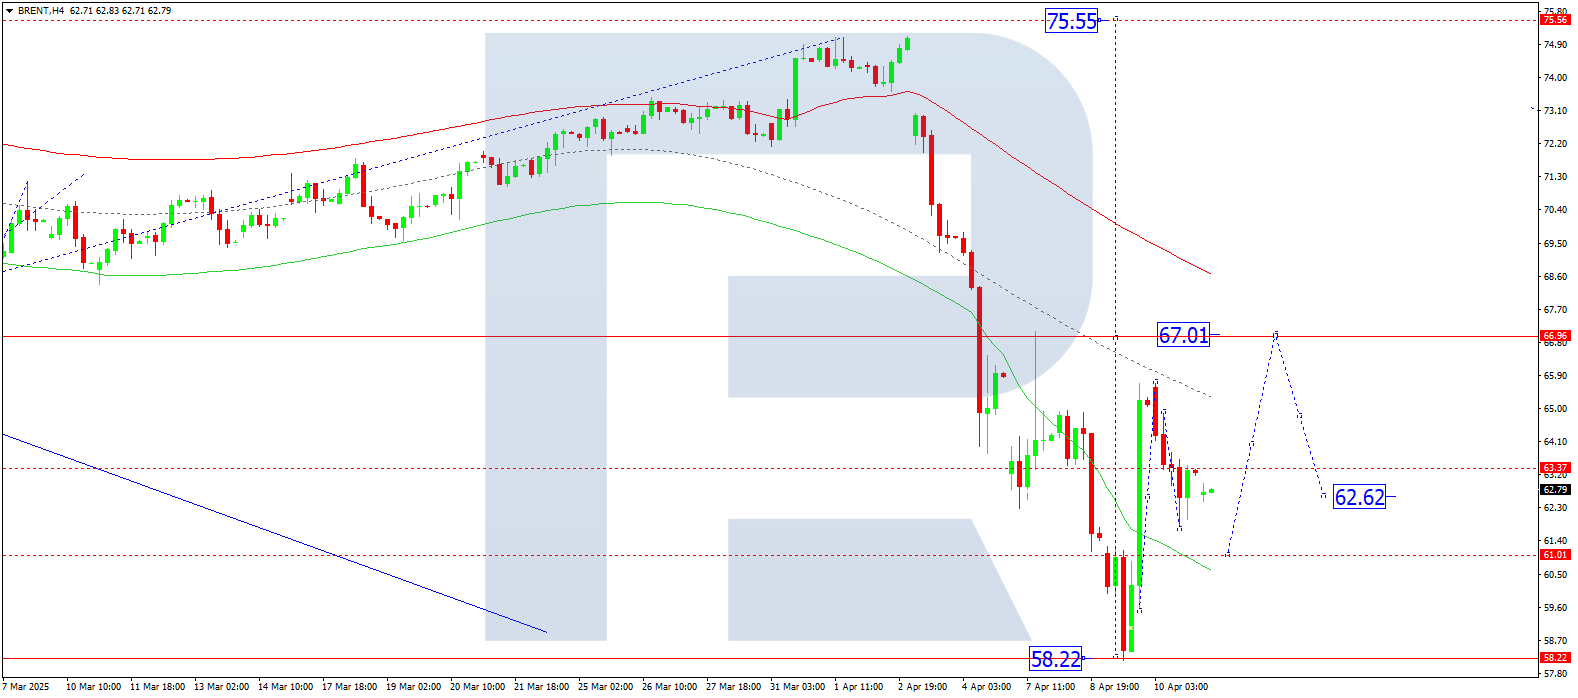
Brent forecast
On the H4 chart of Brent crude, the market is developing a corrective wave to 61.00. Today, 11 April 2025, the correction is expected to complete, followed by a rise towards 67.00, the first target.
Technically, the Elliott wave structure and the downward wave matrix with a pivot at 63.36 confirm this scenario. This level is key in the current correction structure for Brent. Today, the market may complete the correction to the lower boundary of the price Envelope at 61.00, followed by a growth wave to the upper boundary at 67.00.
Technical indicators in today’s Brent forecast suggest a correction ending at 61.00 and a rise to 67.00.
Forecasts presented in this section only reflect the author’s private opinion and should not be considered as guidance for trading. RoboForex bears no responsibility for trading results based on trading recommendations described in these analytical reviews.