USDCAD: US business activity on the brink – what lies ahead for the market
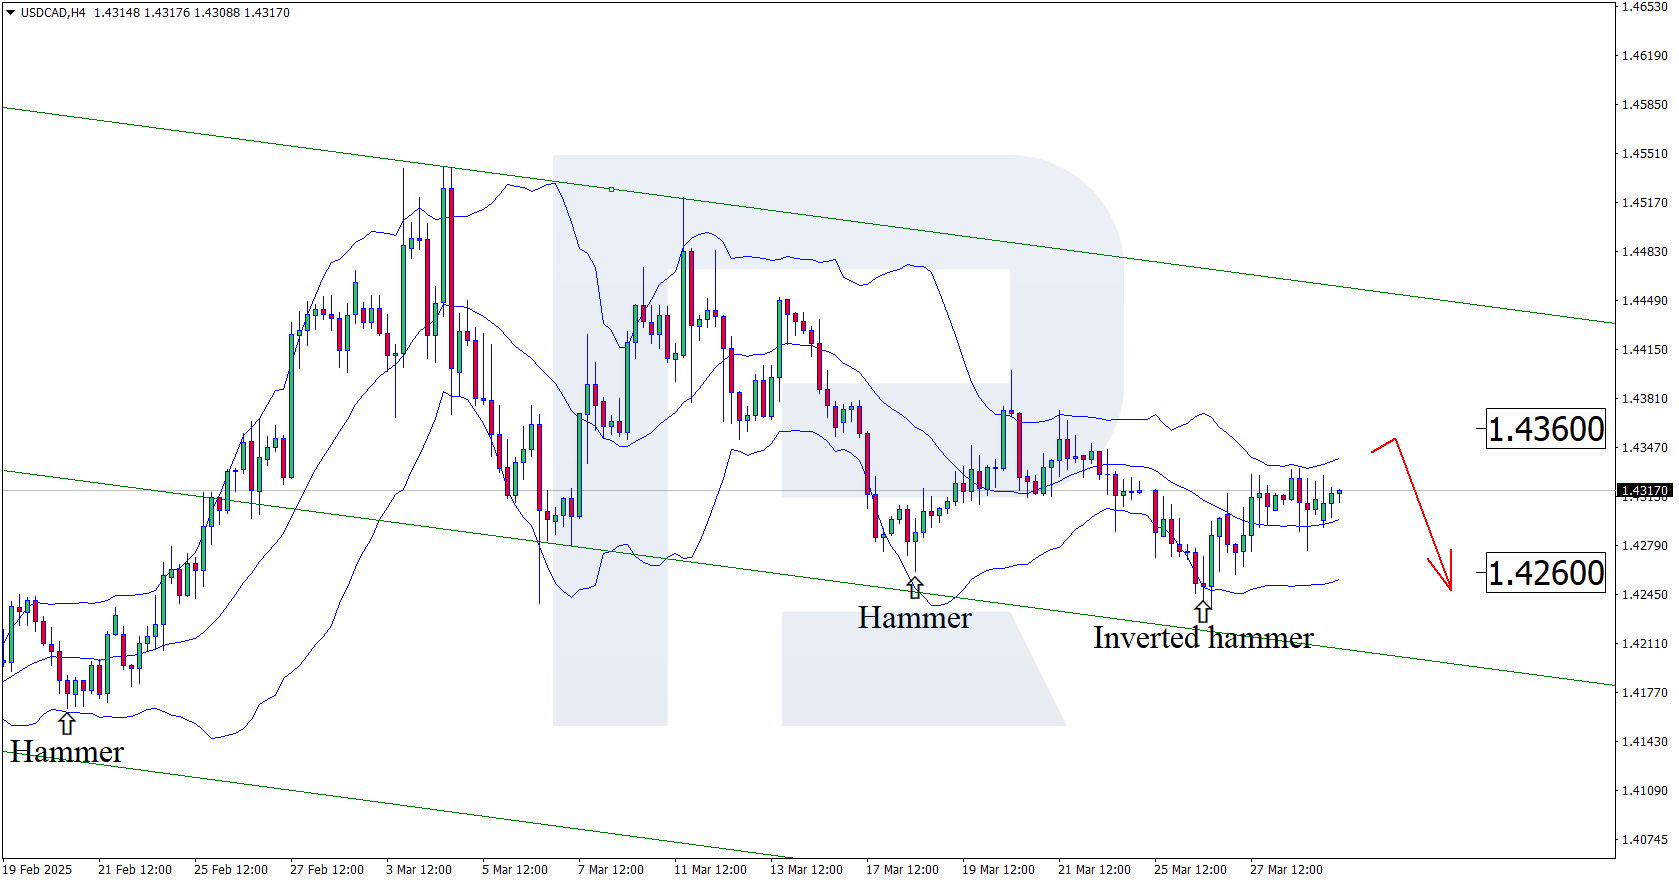
Weakened business activity in Chicago and Dallas could trigger a fall in the USDCAD rate to 1.4260 following a correction. Discover more in our analysis for 31 March 2025.
USDCAD forecast: key trading points
- Chicago PMI: previously at 45.5, projected at 45.5
- Dallas Fed Manufacturing Index: previously at -8.3, projected at -1.7
- USDCAD forecast for 31 March 2025: 1.4360 and 1.4260
Fundamental analysis
The Chicago PMI is an economic indicator that measures the level of business activity in Chicago’s manufacturing and service sectors. It is calculated by ISM-Chicago based on surveys of purchasing managers.
A reading above 50.0 indicates that the economy of the region is expanding, while a reading below 50.0 signals contraction. As a major industrial and logistical hub, Chicago’s performance often reflects broader US economic trends.
The USDCAD forecast for today suggests the Chicago PMI may remain flat at 45.5. If the actual figure matches or falls below that level, it may put pressure on the US dollar and weigh on the USDCAD pair.
The Dallas Fed Manufacturing Index gauges the performance of Texas’s manufacturing sector. It is calculated by the Federal Reserve Bank of Dallas based on surveys of local manufacturers.
A reading above zero indicates growth, while the one below zero signals a downturn. This index is important as Texas is a key industrial state closely tied to the oil, gas, engineering, and tech industries.
The indicator is used to forecast economic trends in the region and provides valuable insight into business sentiment, order flow, employment, and investment.
Fundamental analysis for 31 March 2025 takes into account that the index may improve to -1.7 from the previous -8.3. Despite the improvement, the indicator remains in negative territory, suggesting that Texas manufacturing remains under strain.
USDCAD technical analysis
On the H4 chart, the USDCAD price formed an Inverted Hammer reversal pattern near the lower Bollinger band. At this stage, it continues its upward trajectory following the signal received. Since the price remains within a descending channel, a correction towards the nearest resistance level at 1.4360 is expected. If the price rebounds from this resistance, a downtrend may develop.
However, the forecast for 31 March 2025 also suggests an alternative scenario, with the price falling to 1.4260 and gaining bearish momentum after breaking below the support level.
Summary
Weak US economic indicators, combined with USDCAD technical analysis, suggest that the pair may continue its downward trajectory once the correction is complete.
Forecasts presented in this section only reflect the author’s private opinion and should not be considered as guidance for trading. RoboForex bears no responsibility for trading results based on trading recommendations described in these analytical reviews.


